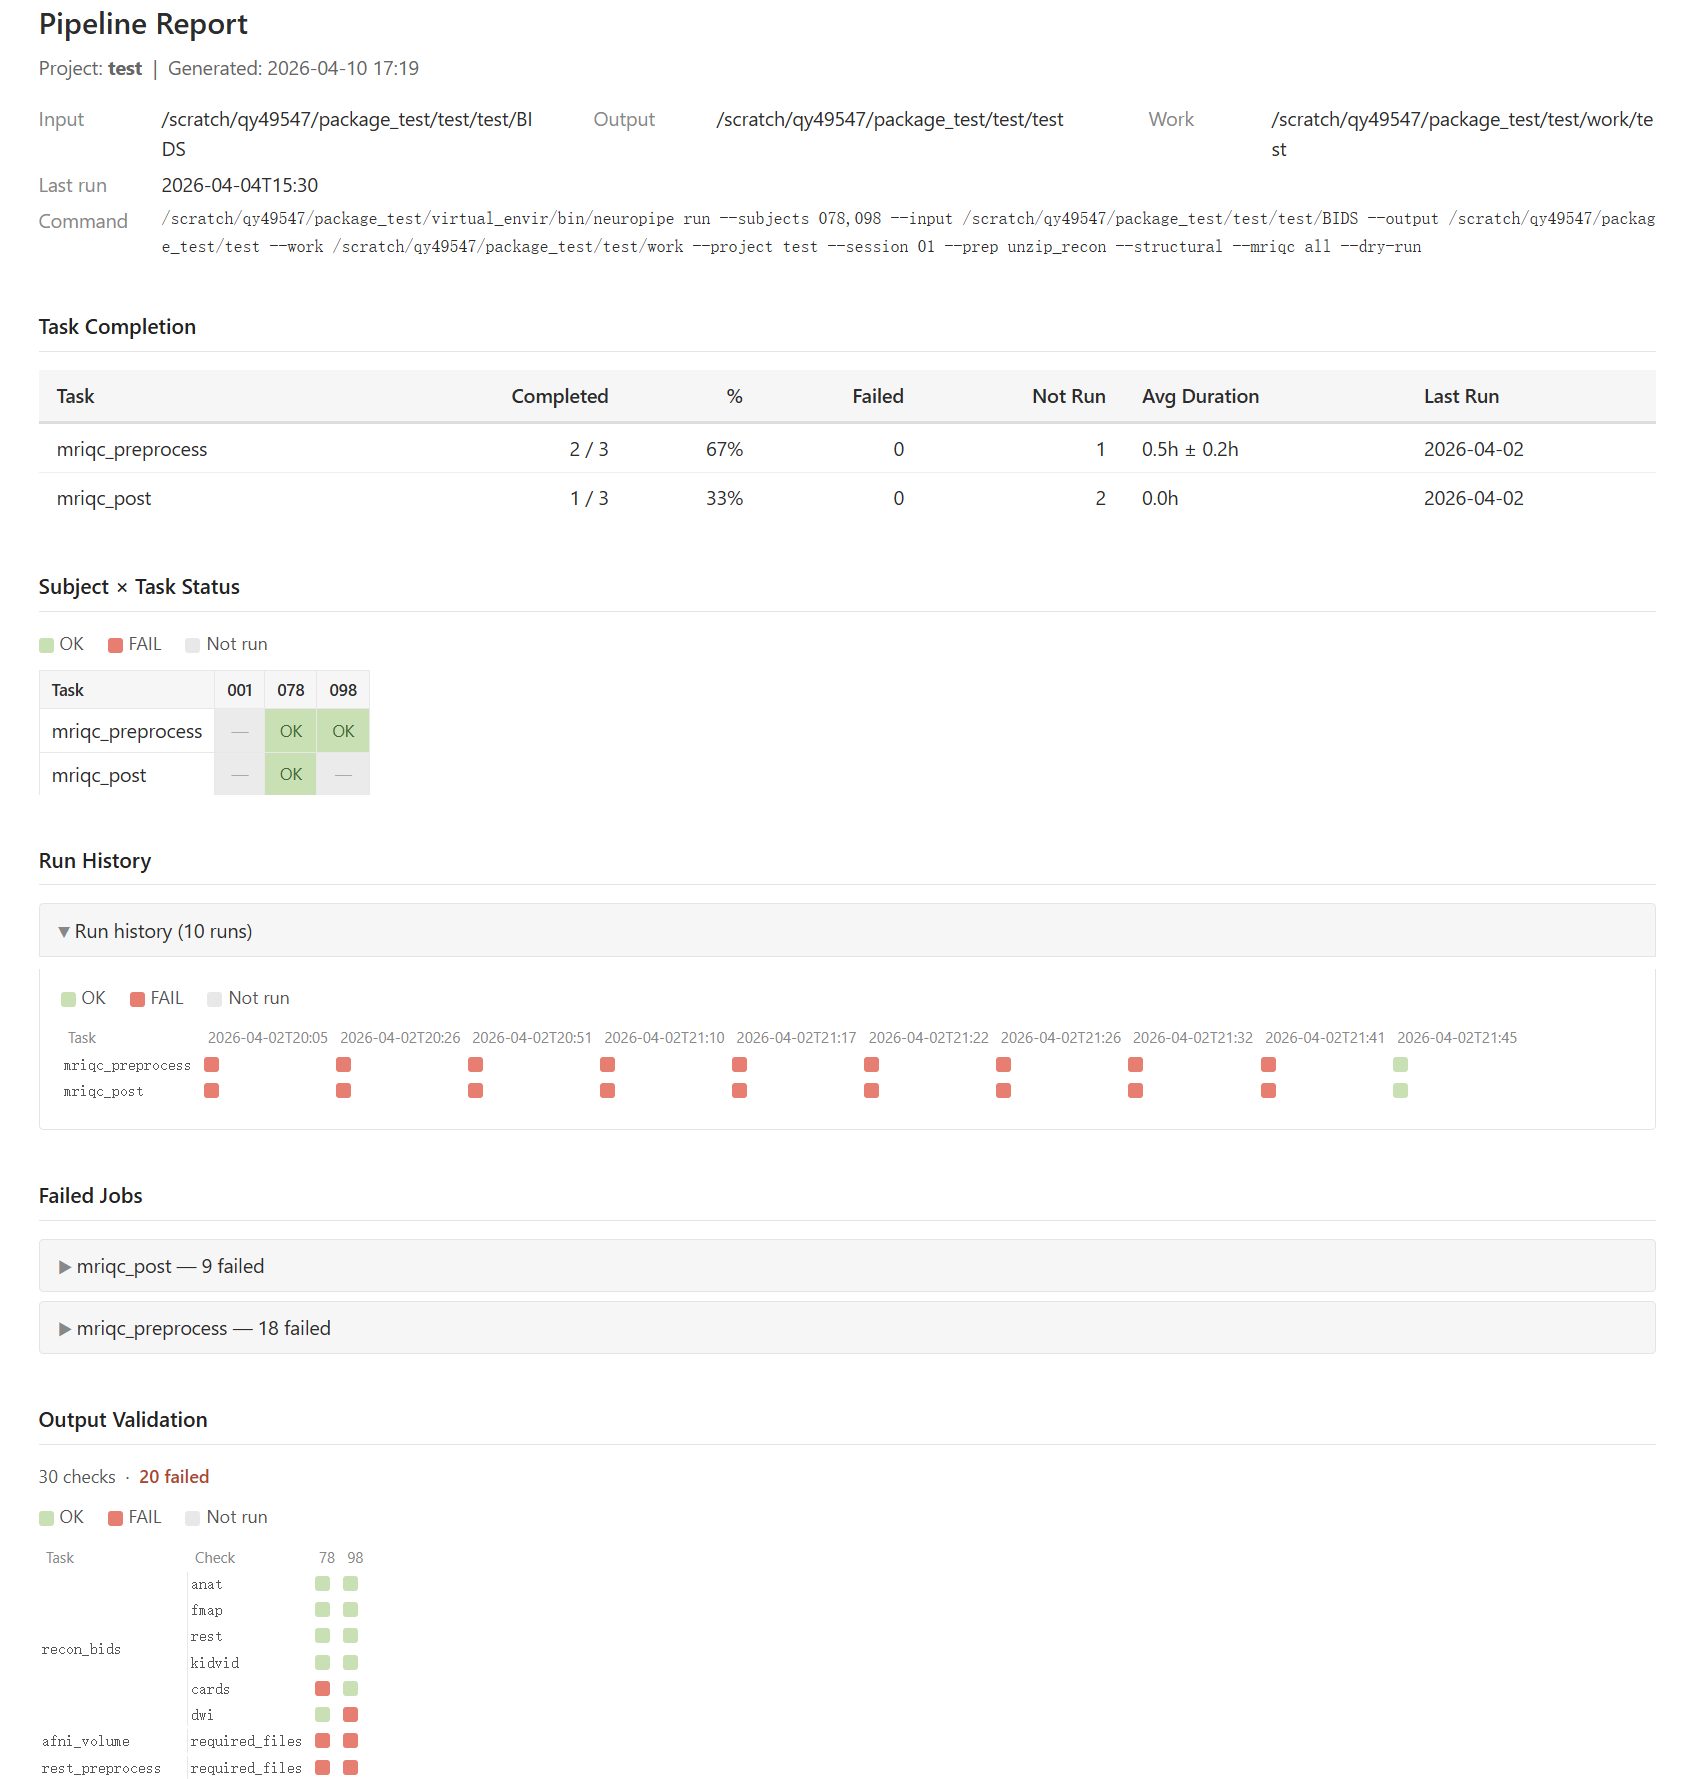
The web-based GUI provides the same functionality as the CLI — submitting jobs, editing config files, monitoring results — through an interactive dashboard.
neuropipe-gui                 # default port 8050
neuropipe-gui --port 8051     # if 8050 is already in use
Open http://localhost:8050 in your browser. The GUI has three top-level tabs:
| Tab | Purpose |
|---|---|
| Analysis Control | Configure and submit pipeline jobs |
| Project Config | Create and edit config files |
| Job Monitor | Query job status, check outputs, generate reports |
Typical workflow
For a first run:
Project Config → create or load your
{project}_config.yamlAnalysis Control → select subjects, fill in paths, choose tasks, click Generate Command, then Execute Pipeline
Job Monitor → Database Configuration → click Sync Database after jobs finish
Job Monitor → Output File Check → verify outputs per subject
Job Monitor → Generate Report → produce HTML summary report
For re-runs after failures: go back to Analysis Control, enable Resume Mode, and click Execute Pipeline again.
Analysis Control
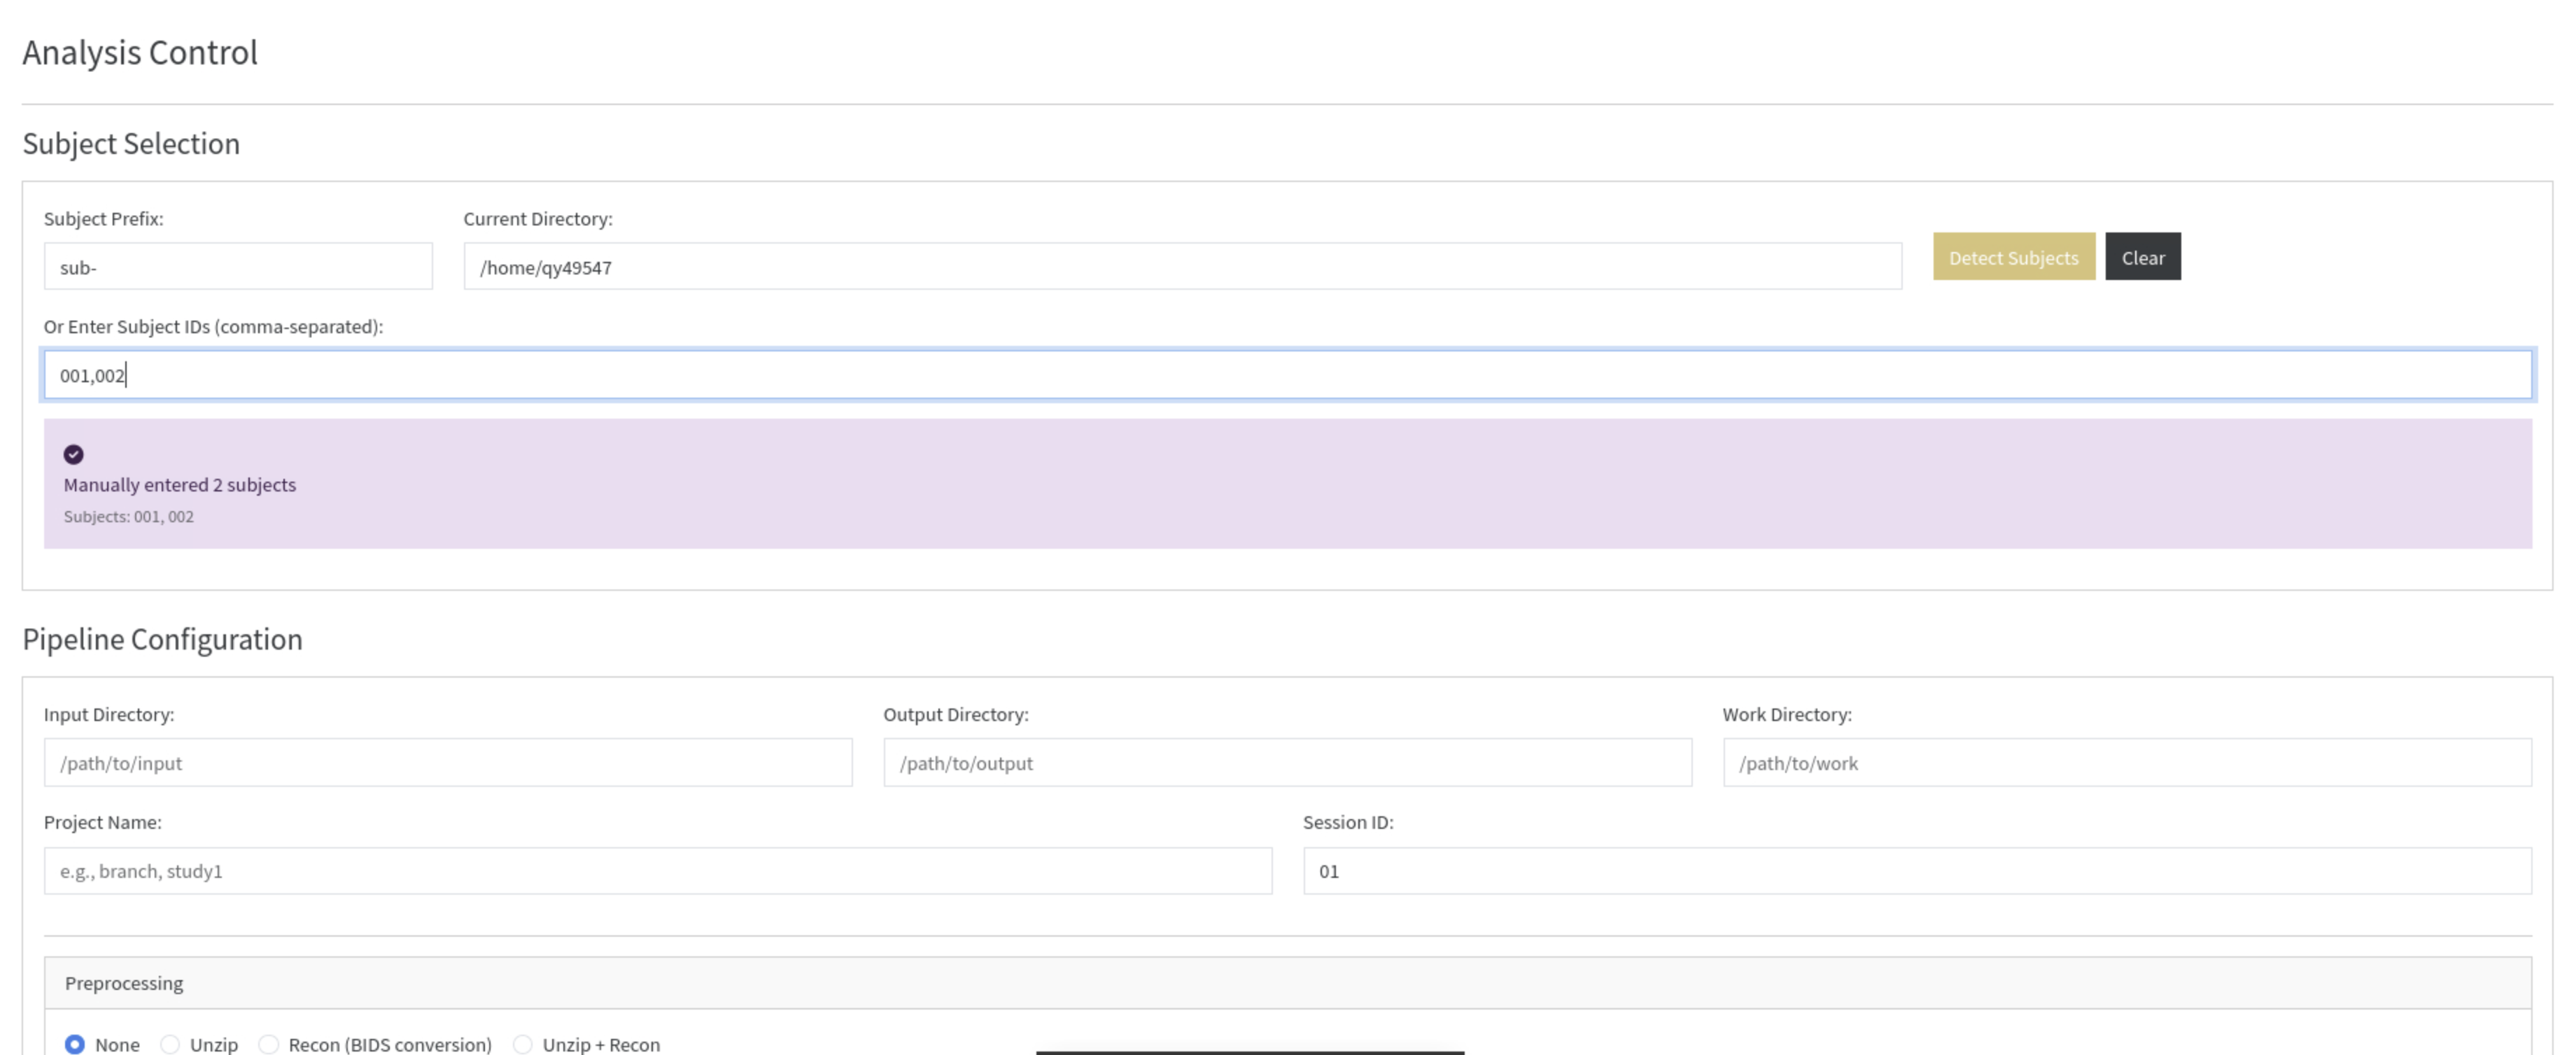
This tab is the GUI equivalent of neuropipe run. Configure everything here and click Execute Pipeline to submit.
Config Directory
The config directory must be set before task options (Intermed, BIDS, Staged) can populate. Enter the path to your config/ folder, then choose one of two actions:
Init — first-time setup for a new study. Copies the package template files (
config.yaml,hpc_config.yaml, script templates) into the given directory, creating it if needed. Equivalent toneuropipe init. After Init completes, click Apply to load the config.Apply — load an existing config directory. Reads
config.yamland populates the task checklists (Intermed, BIDS pipelines, Staged pipelines) with the tasks defined in your config.
Subject Selection
Two ways to specify subjects:
Auto-detect from directory — enter the directory containing your subject folders and set the prefix (default sub-), then click Detect Subjects. The pipeline scans the directory and populates the subject list automatically.
Manual entry — type subject IDs directly in the comma-separated field (e.g. 001,002,003 or sub-001,sub-002). Both formats are accepted — the prefix is stripped automatically.
Pipeline Configuration
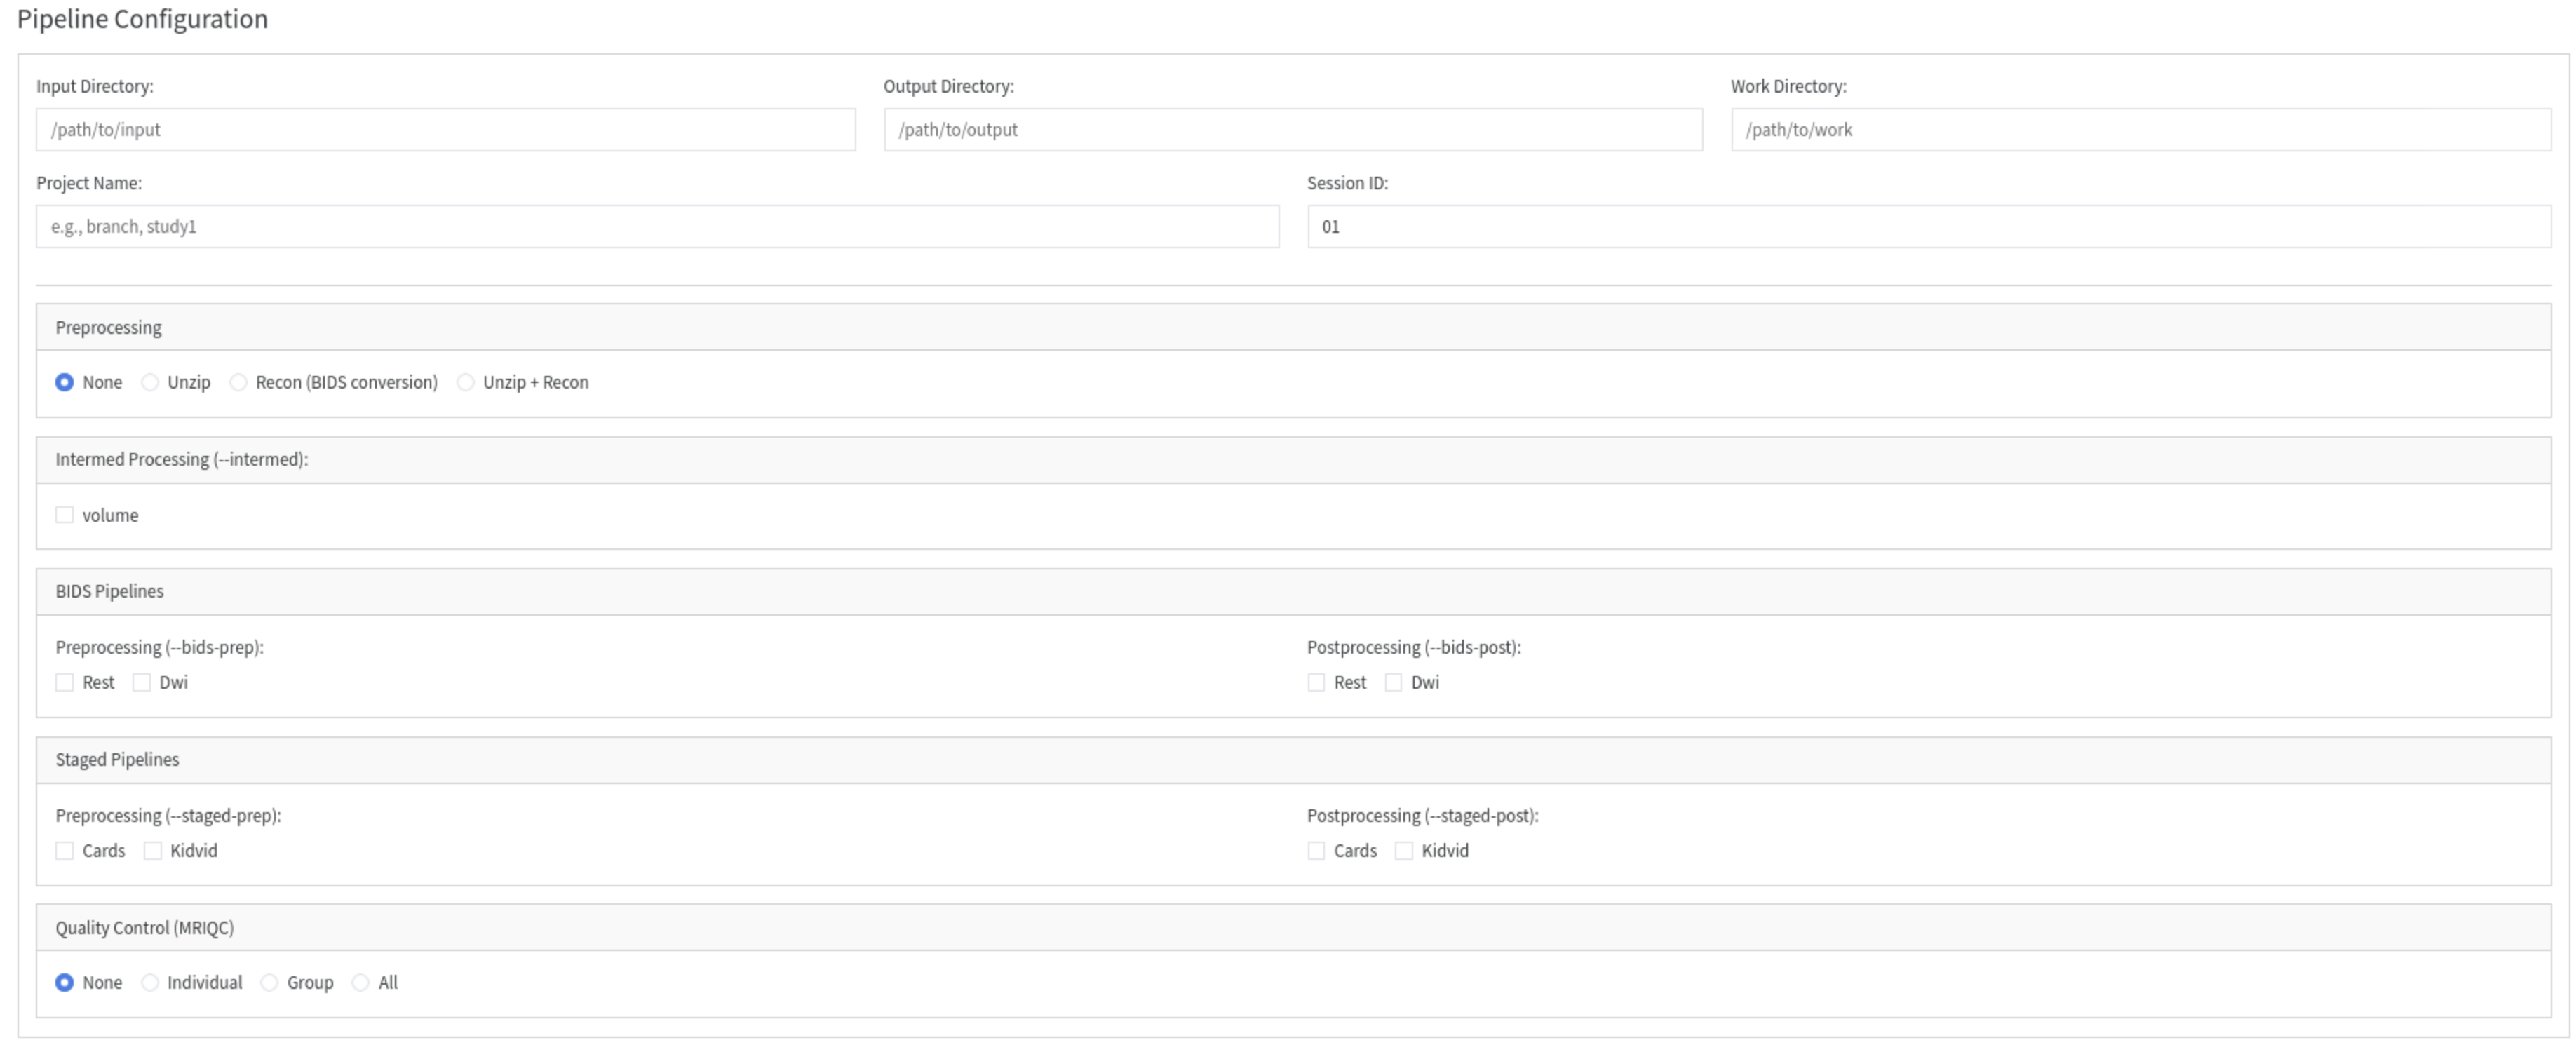
Fill in the four path fields (Input, Output, Work, Project Name) and Session ID. These map directly to the --input, --output, --work, --project, and --session flags of neuropipe run.
Task selection is broken into cards by pipeline type:
| Card | Equivalent CLI flag | Selection type |
|---|---|---|
| Preprocessing | --prep | Radio buttons (None / Unzip / Recon / Unzip+Recon) |
| Intermed Processing | --intermed | Checkboxes (one per configured intermed task) |
| BIDS Pipelines | --bids-prep / --bids-post | Checkboxes for prep and post independently |
| Staged Pipelines | --staged-prep / --staged-post | Checkboxes for prep and post independently |
| Quality Control | --mriqc | Radio buttons (None / Individual / Group / All) |
Available options are populated automatically from config.yaml — any task sections you add there will appear here without code changes.
Execution Control
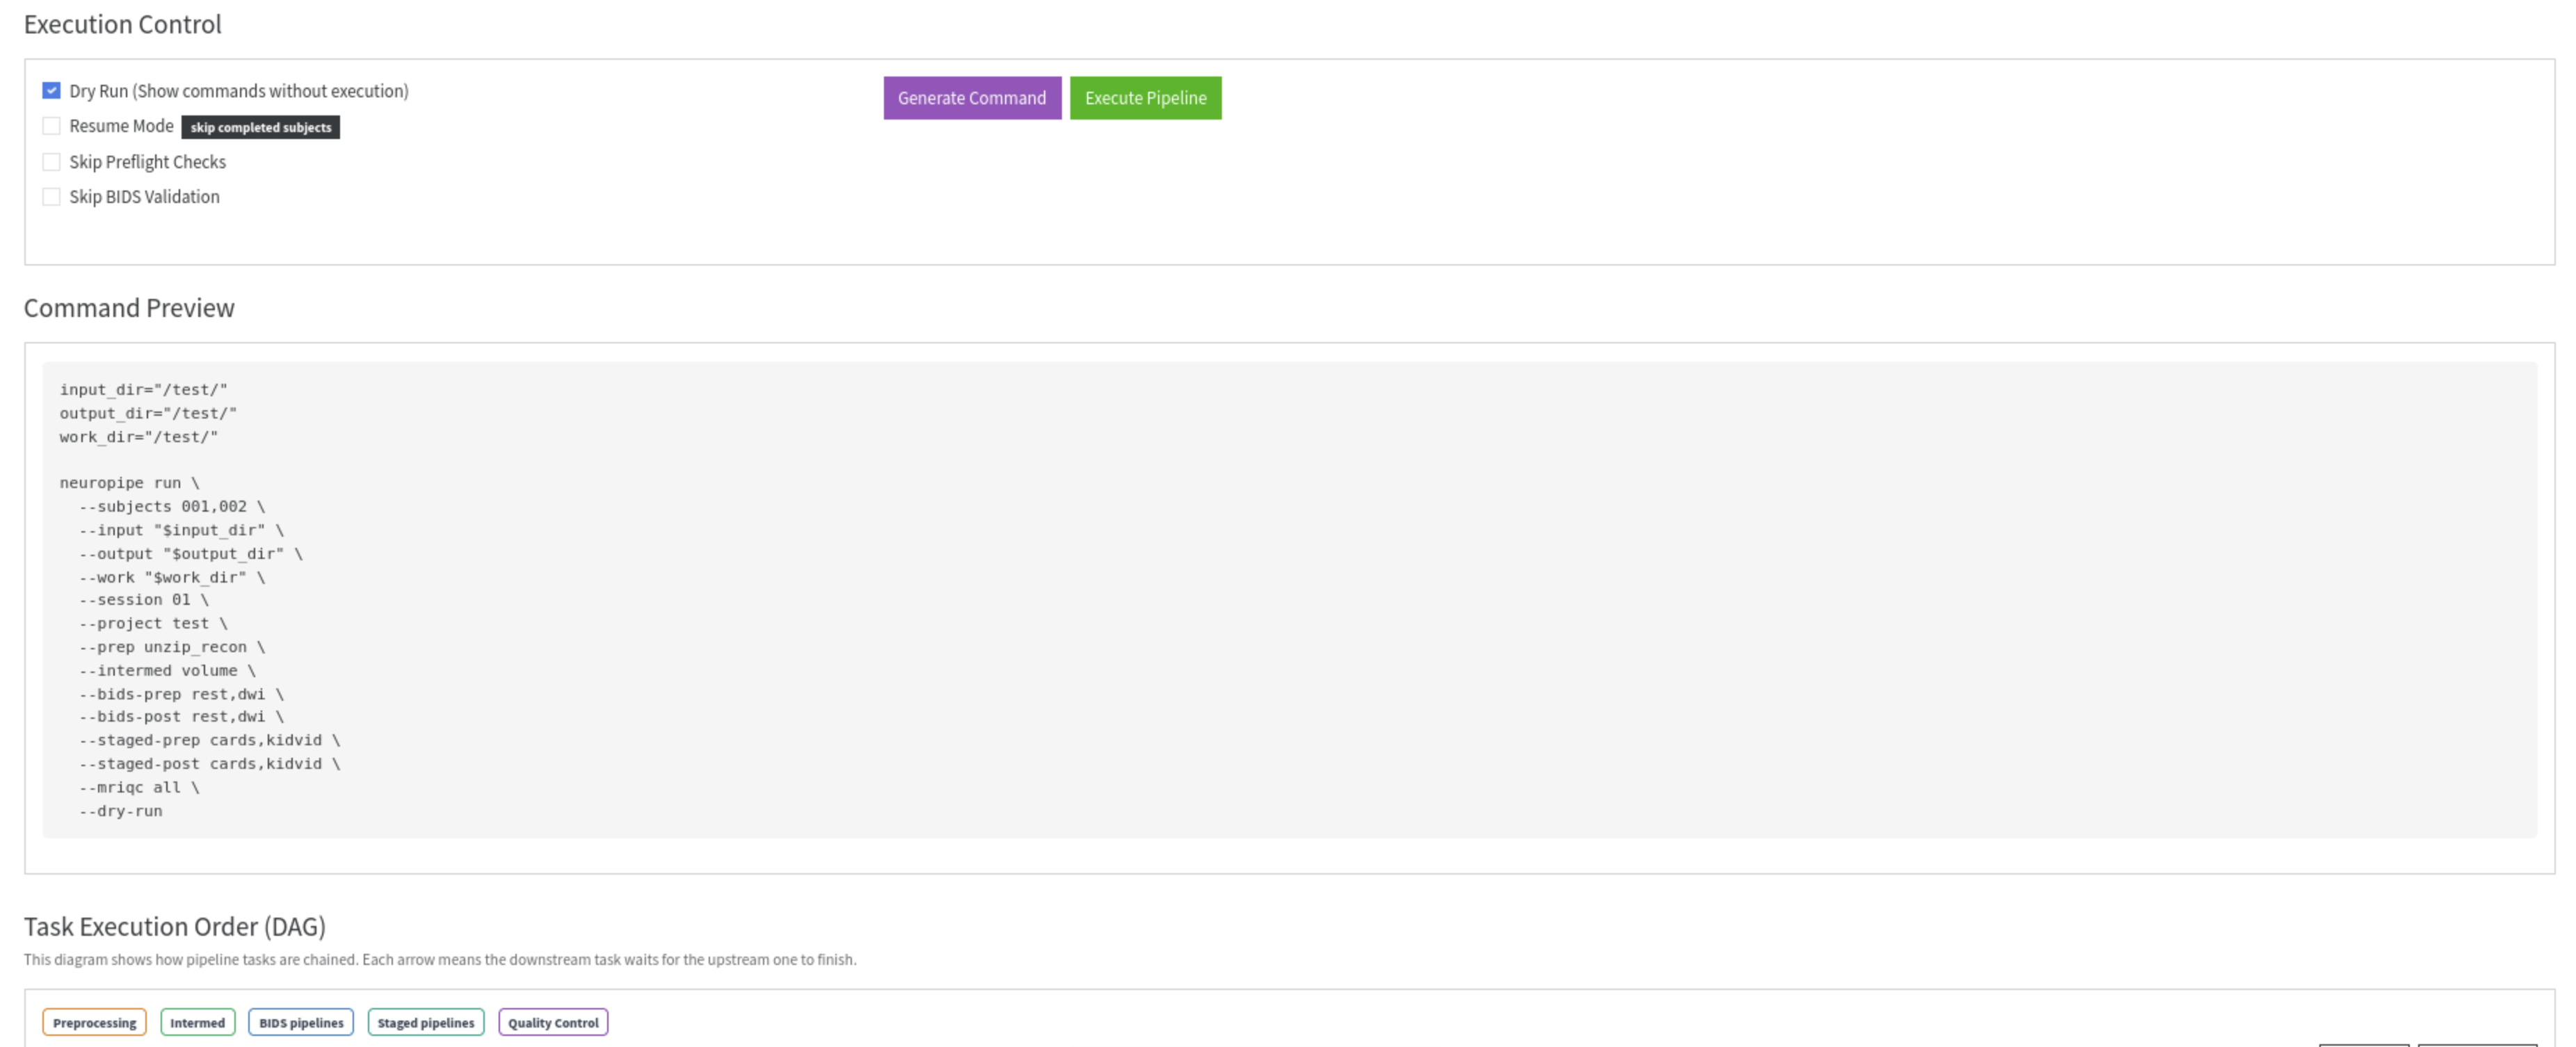
| Option | Default | Equivalent CLI flag |
|---|---|---|
| Dry Run | On | --dry-run |
| Resume Mode | Off | --resume |
| Skip Preflight Checks | Off | --skip-preflight |
| Skip BIDS Validation | Off | --skip-bids-validation |
Dry Run is enabled by default — click Execute Pipeline won’t submit anything until you uncheck it. This prevents accidental submissions.
Two buttons:
Generate Command — builds the
neuropipe runcommand from your current settings and displays it in the Command Preview panel below. No execution.Execute Pipeline — submits the jobs (or runs the dry-run if checked).
After clicking Execute Pipeline, the execution status area shows:
Green — pipeline submitted successfully; stdout from
neuropipe runis shown (job IDs, DAG plan, summary)Red — submission failed; stderr is shown for debugging
Yellow — no command available; Generate Command has not been clicked yet
Command Preview
Shows the exact neuropipe run command that would be (or was) executed. Copy this to reproduce the run from the CLI, save it for your records, or share it for debugging.
DAG Visualization
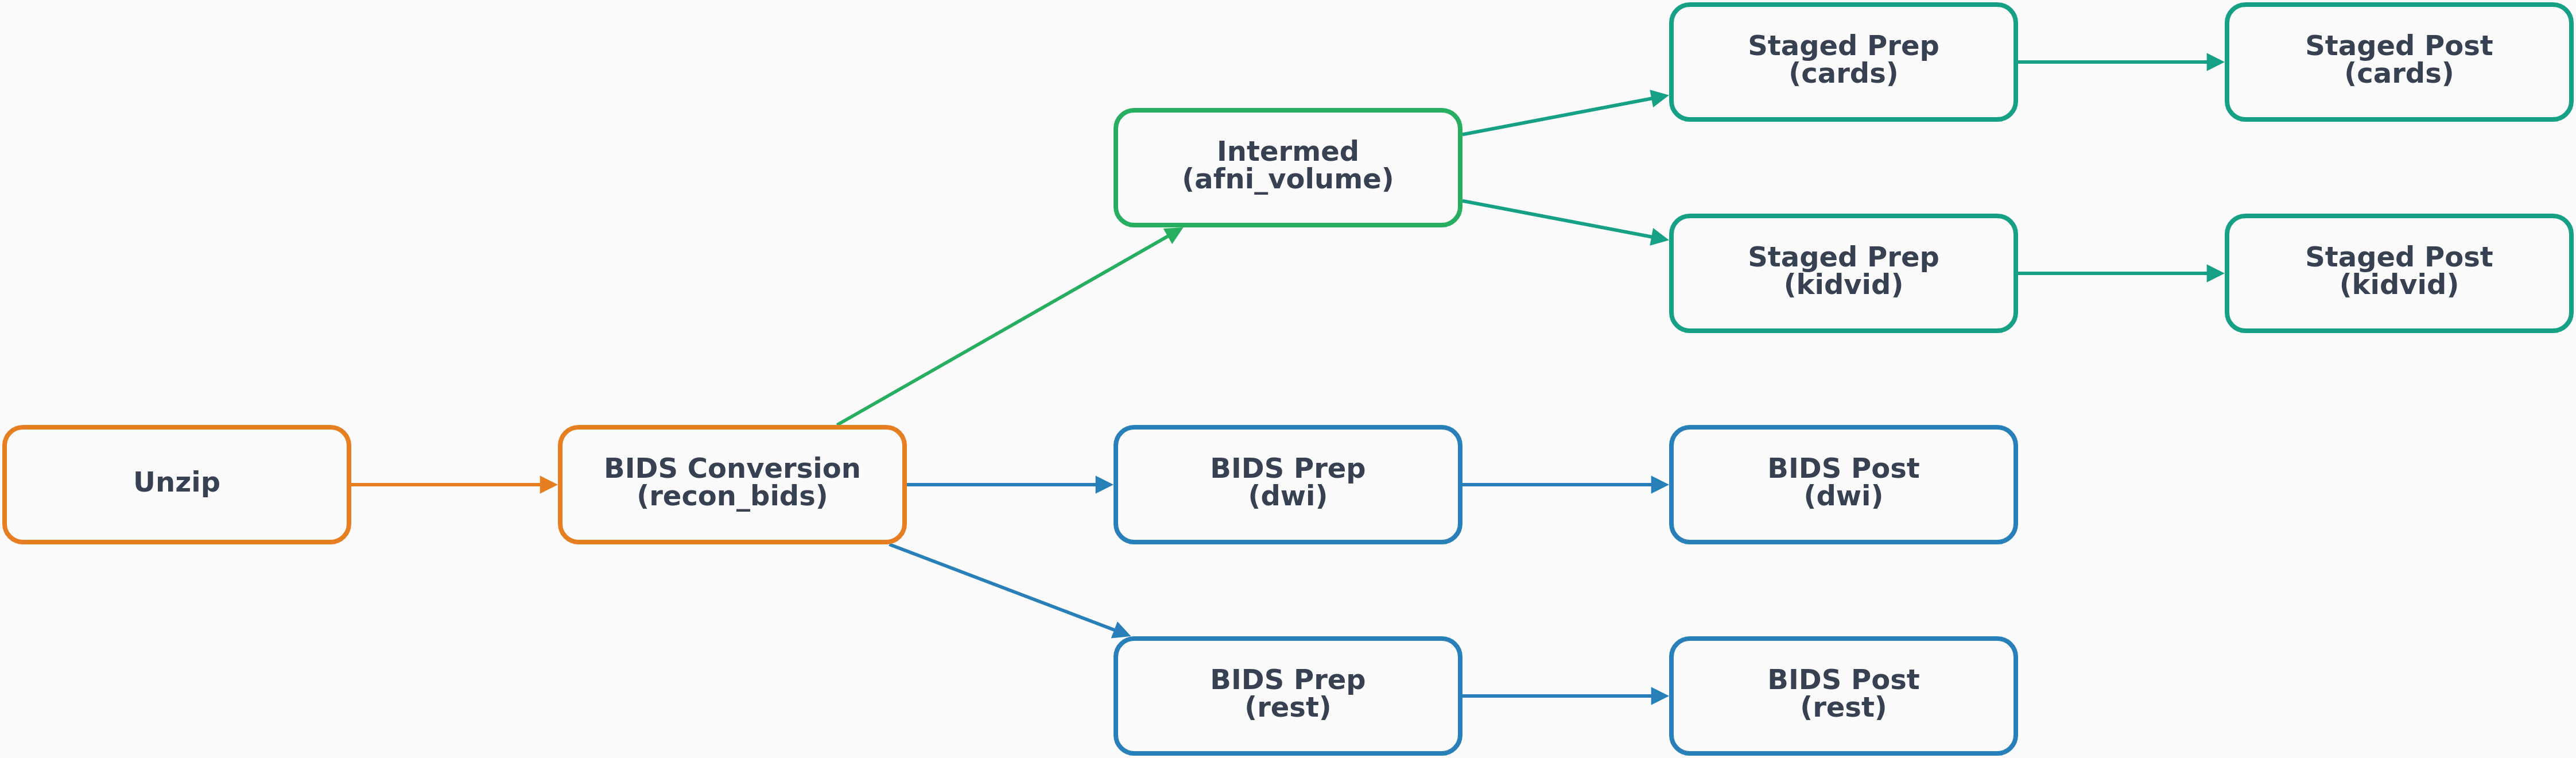
A live dependency graph that updates as you change task selections. Nodes are color-coded by pipeline type:
| Color | Pipeline type |
|---|---|
| Orange | Preprocessing |
| Green | Intermed |
| Blue | BIDS pipelines |
| Teal | Staged pipelines |
| Purple | Quality Control |
Use Reset View to re-center the graph and Download PNG to save it as an image.
Project Config
This tab has four sub-tabs for editing the four config files that drive the pipeline.
Project Config sub-tab
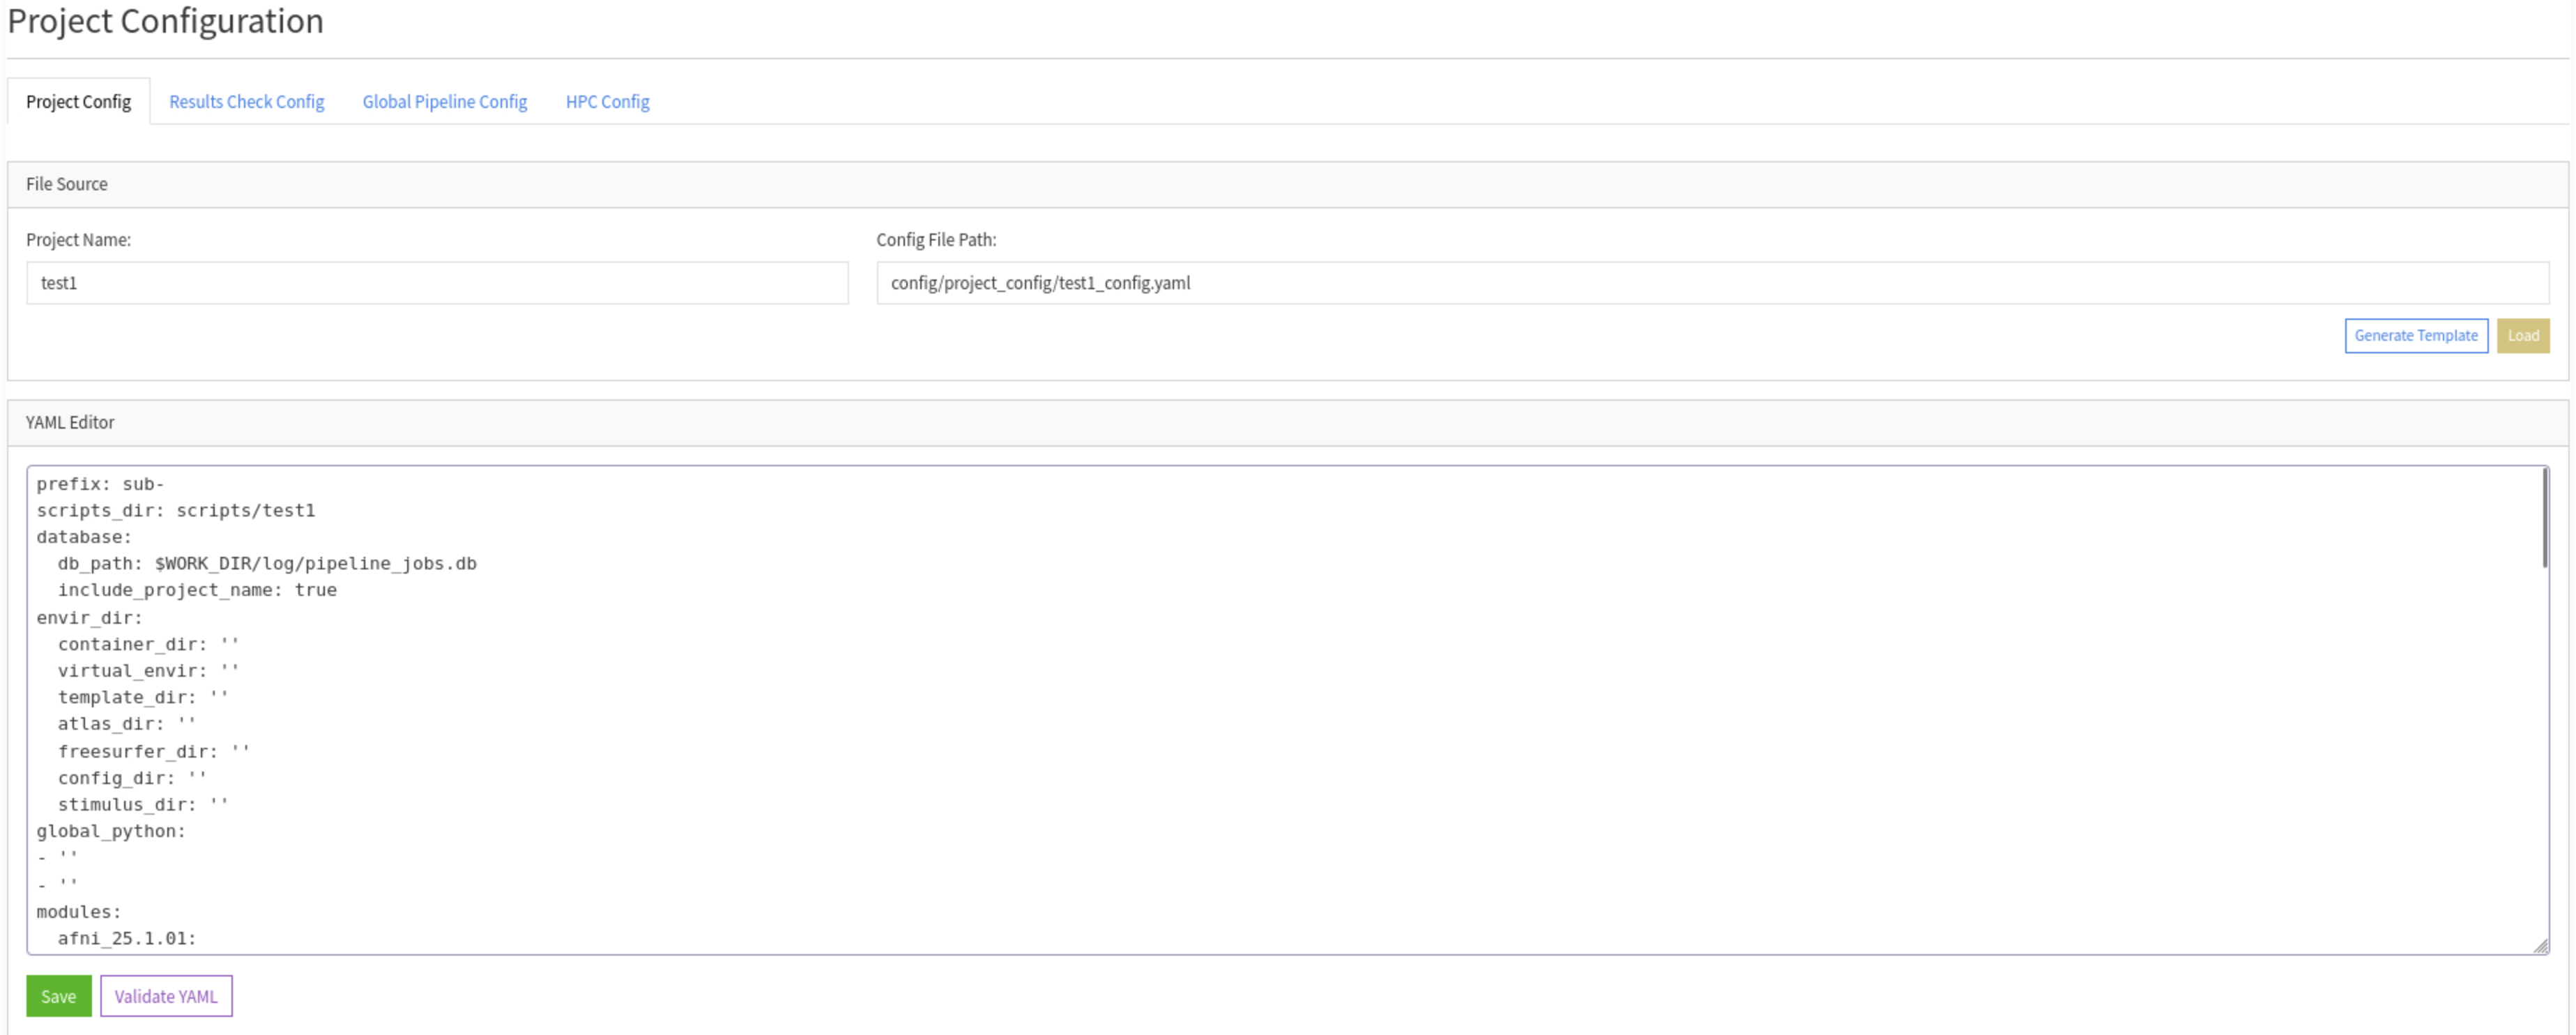
Enter a project name and the path auto-fills to config/project_config/{project}_config.yaml. Two entry points:
Generate Template — creates a new config with all required fields and placeholder values. Start here for a new project.
Load — loads an existing config file into the editor.
Edit the YAML directly in the editor, then:
Validate YAML — checks syntax and required fields without saving.
Save — writes the file to disk.
See Project Config Guide for field-by-field documentation.
Results Check Config sub-tab
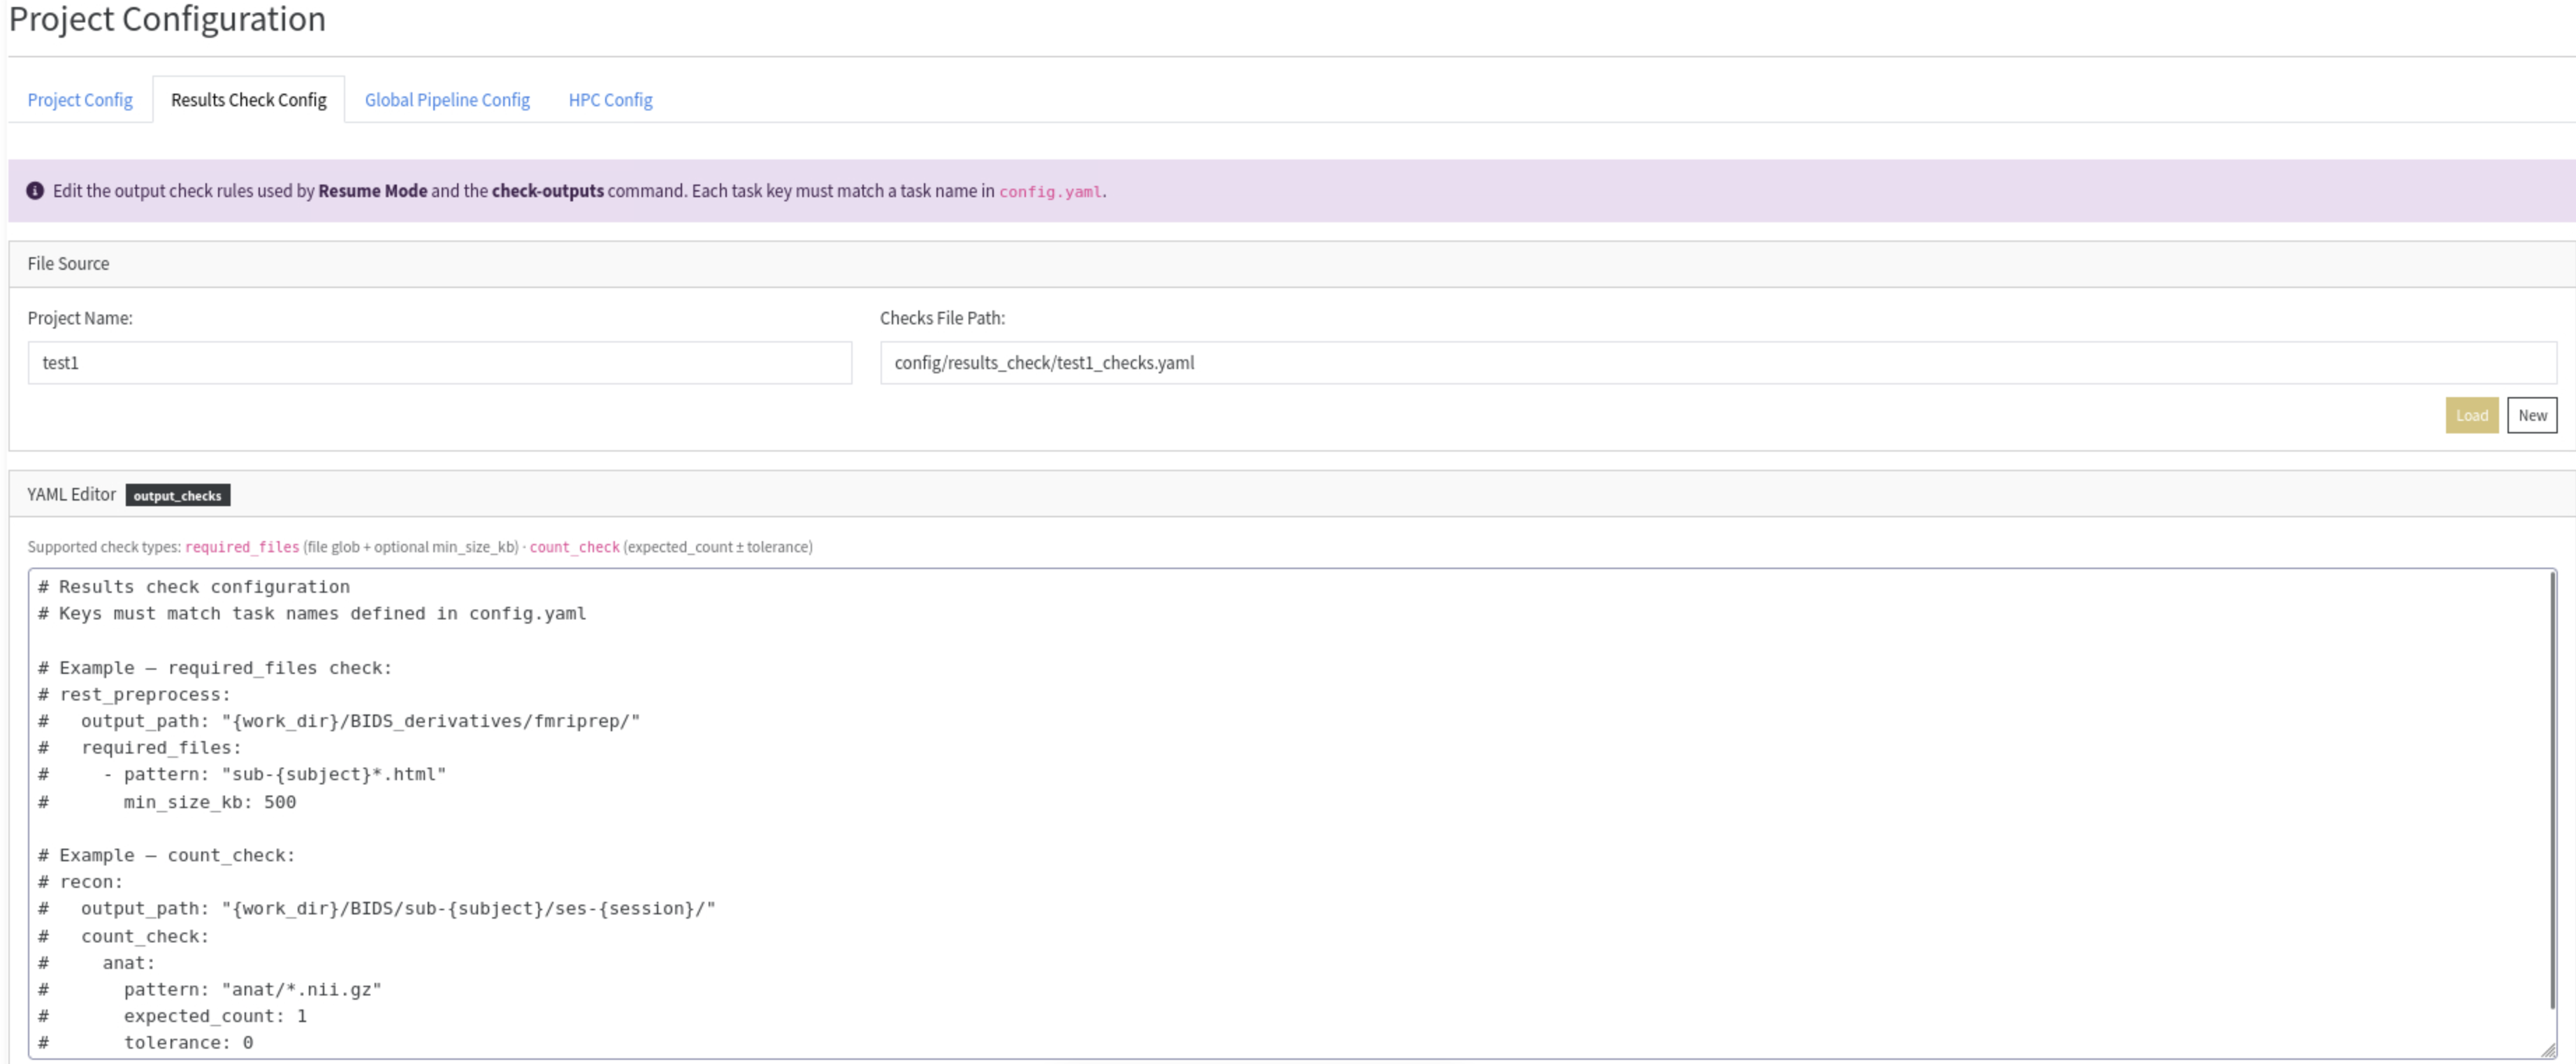
Edit the output check rules used by Resume Mode and check-outputs. Enter your project name to load or create {project}_checks.yaml inside <config-dir>/results_check/.
The editor hints show both supported check types (required_files with optional min_size_kb, and count_check with expected_count ± tolerance). See Output Checks Config for syntax details.
Global Pipeline Config sub-tab
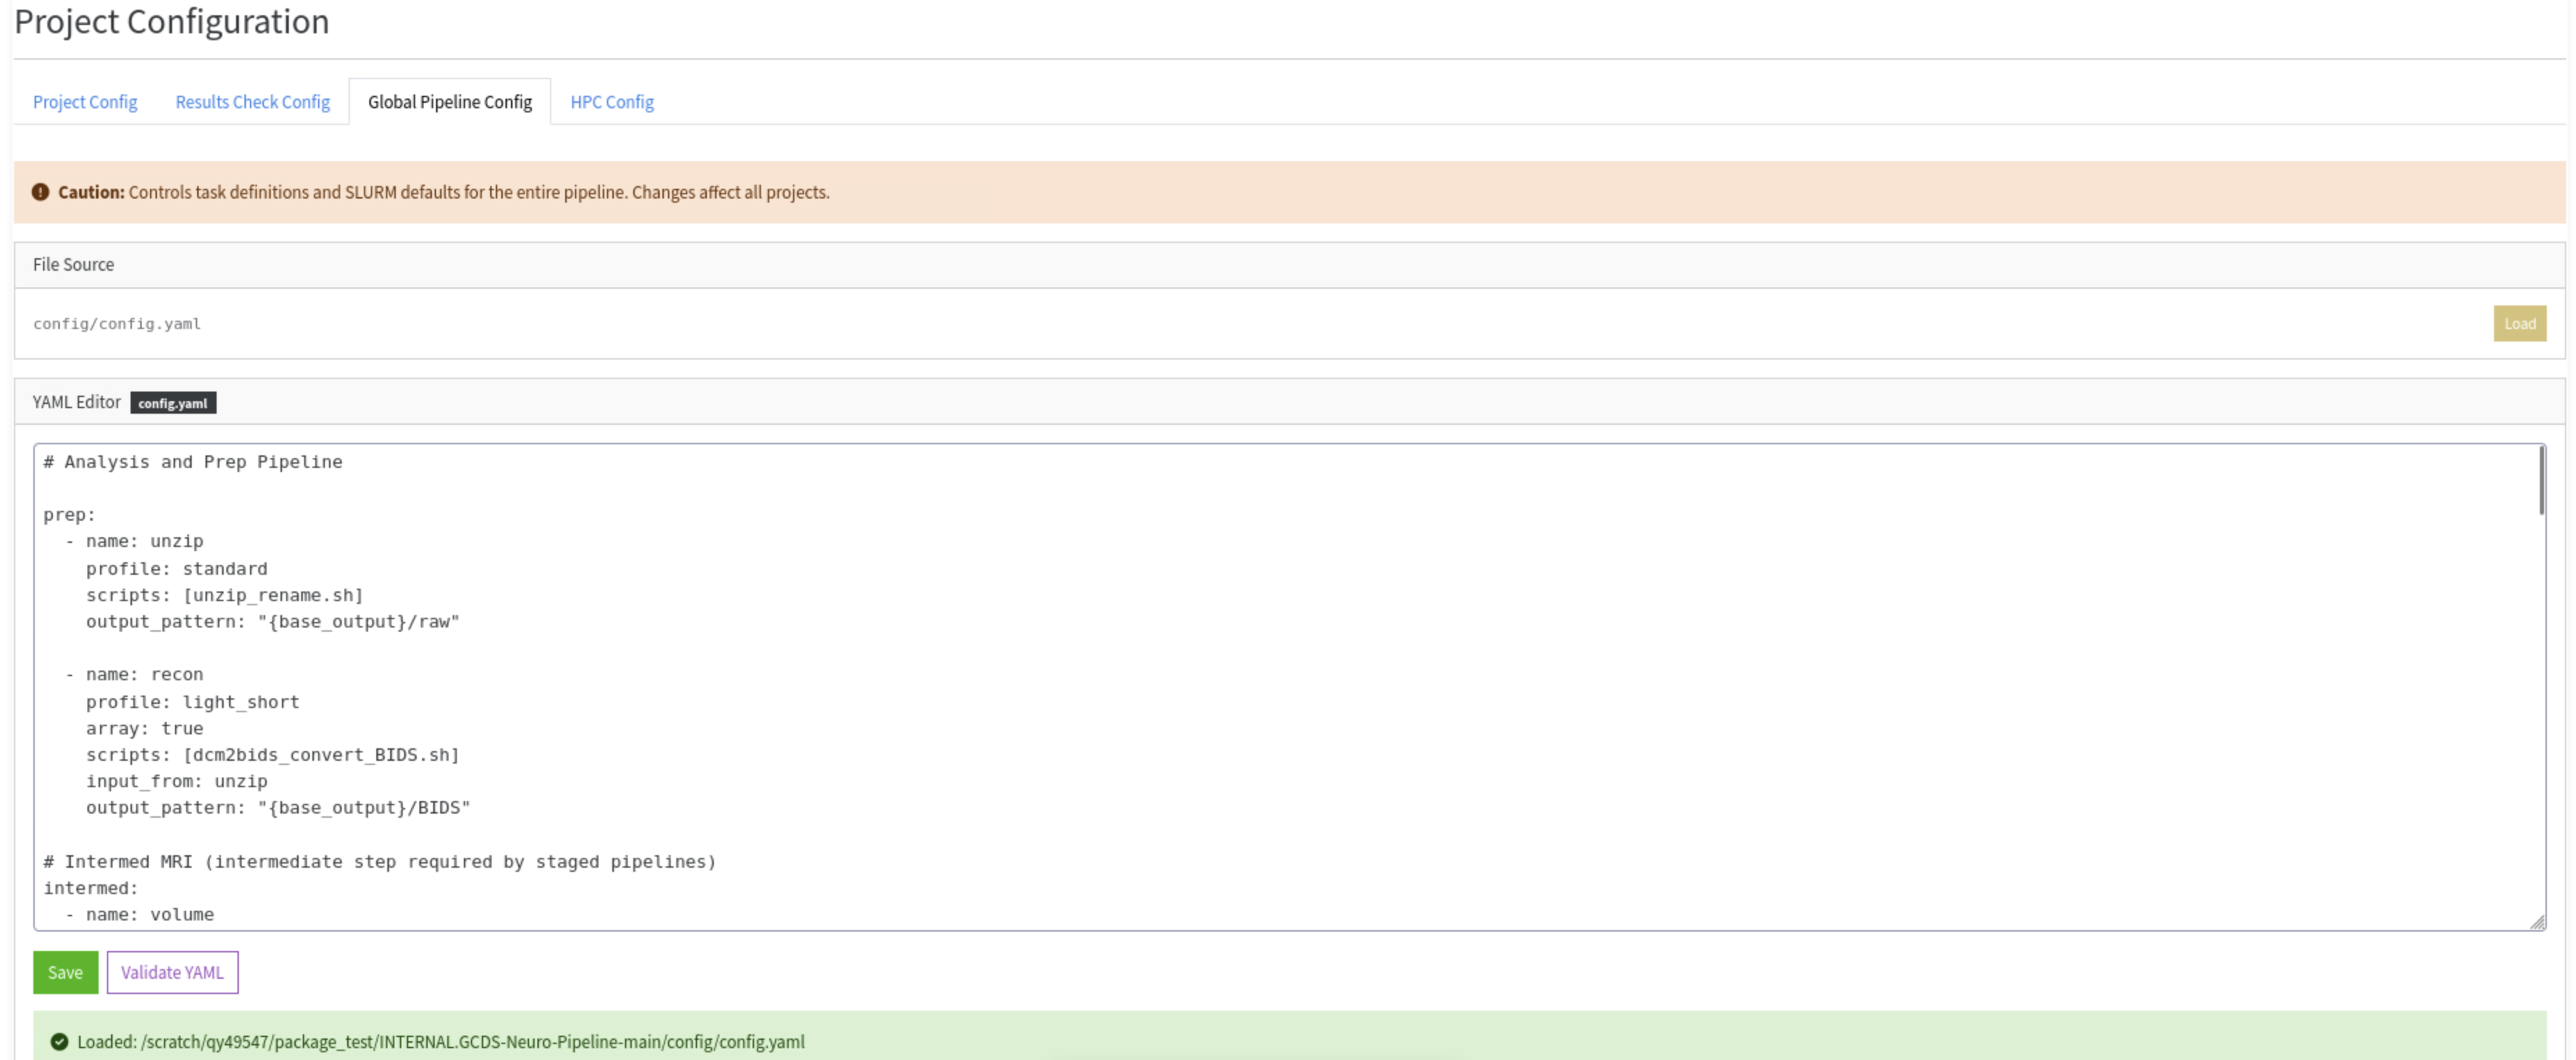
Load, edit, validate, and save config/config.yaml directly. Use this when adding a new task section or adjusting resource limits.
HPC Config sub-tab
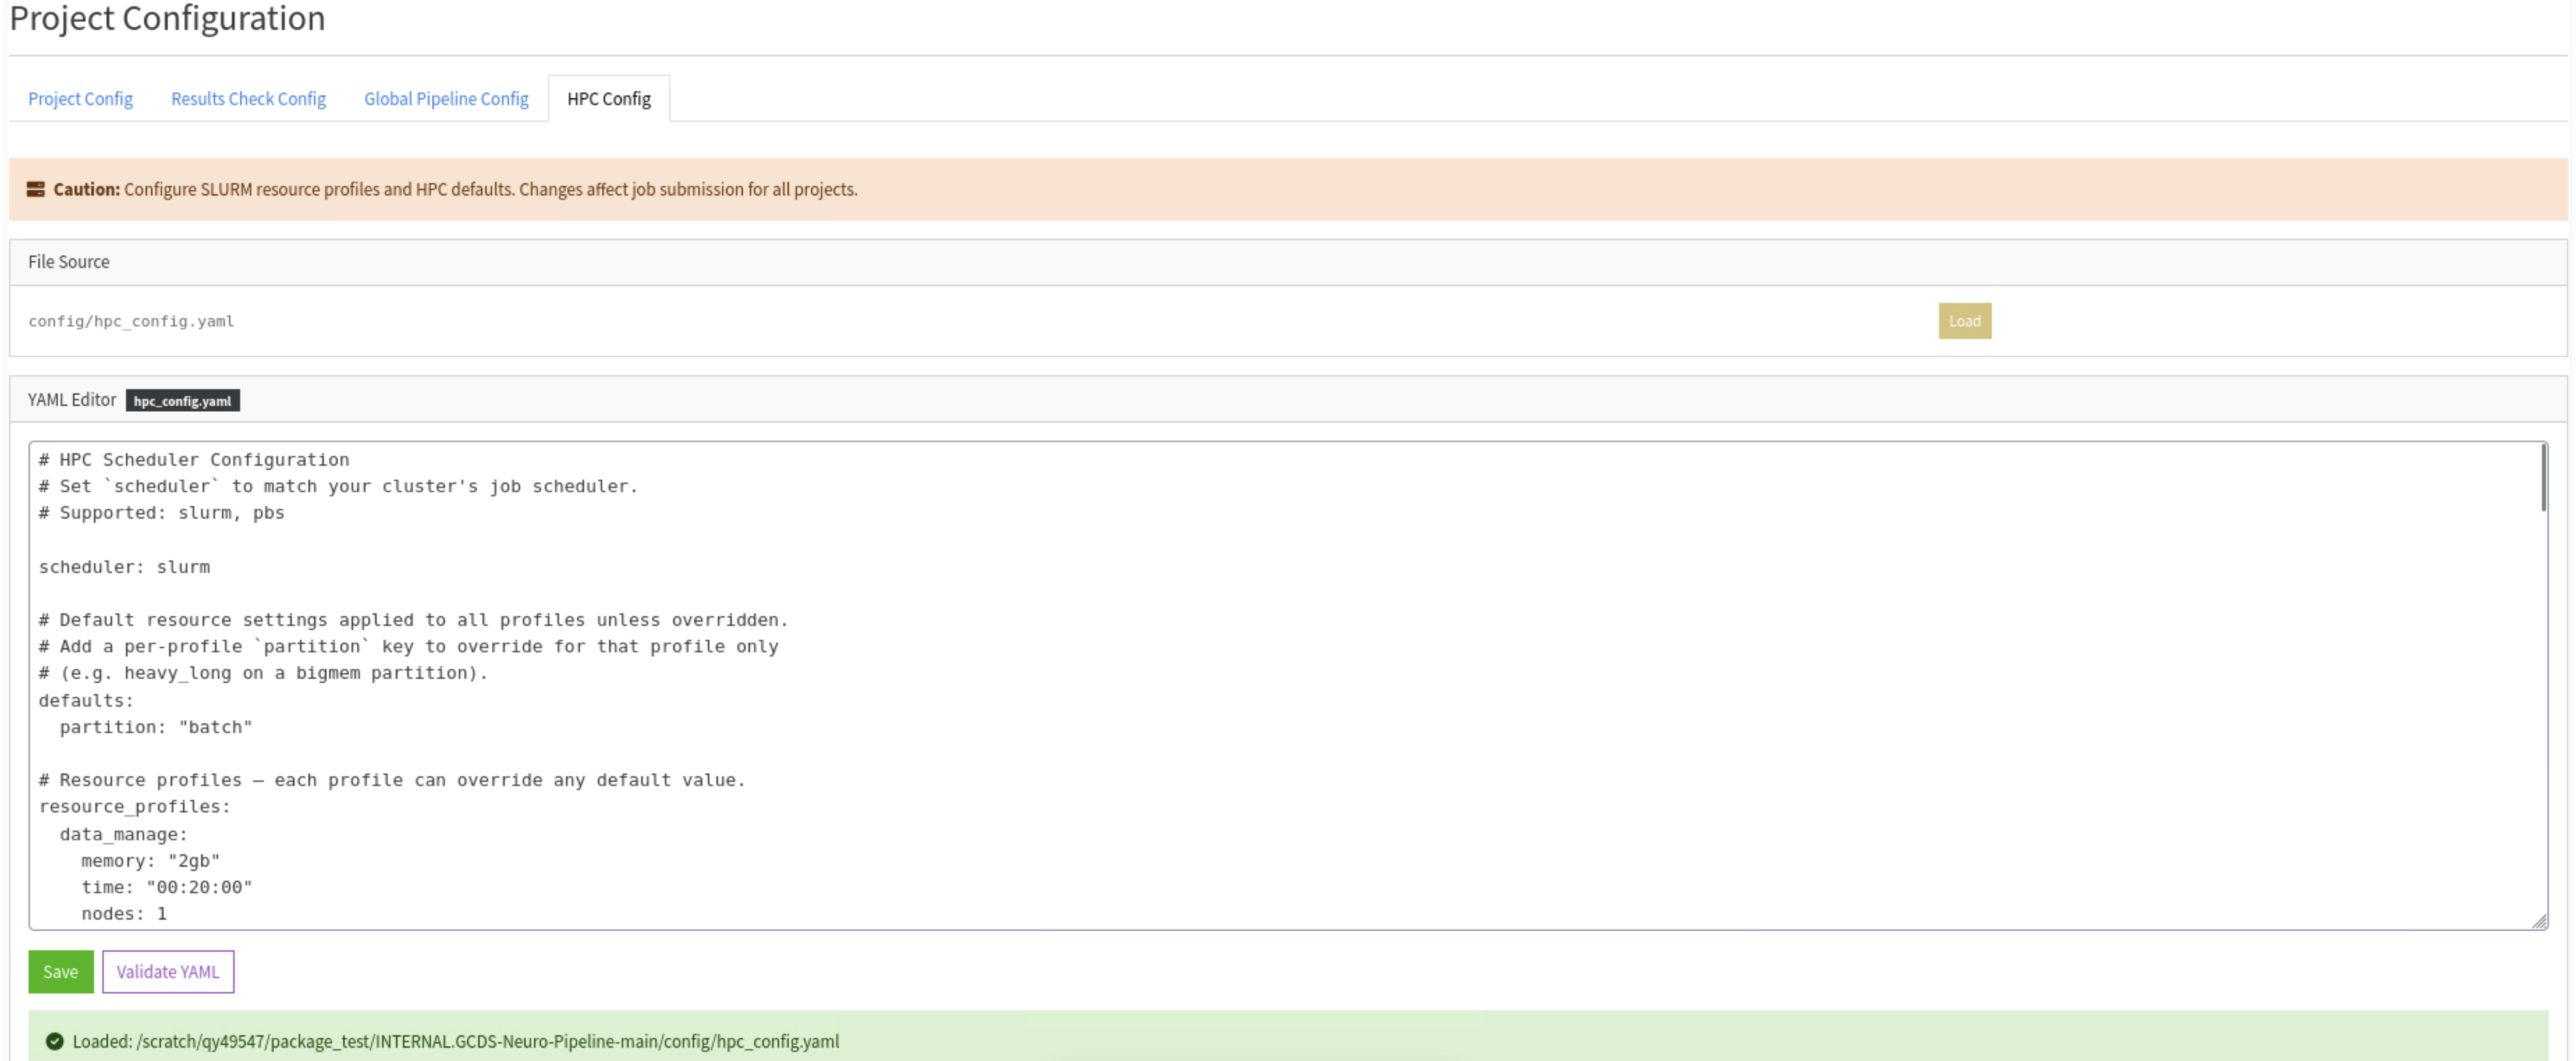
Edit config/hpc_config.yaml — scheduler selection, resource profiles, and SLURM/PBS flag templates. See HPC Config.
Job Monitor
The database path and work directory are set once at the top and shared across all three tabs.
Database tab
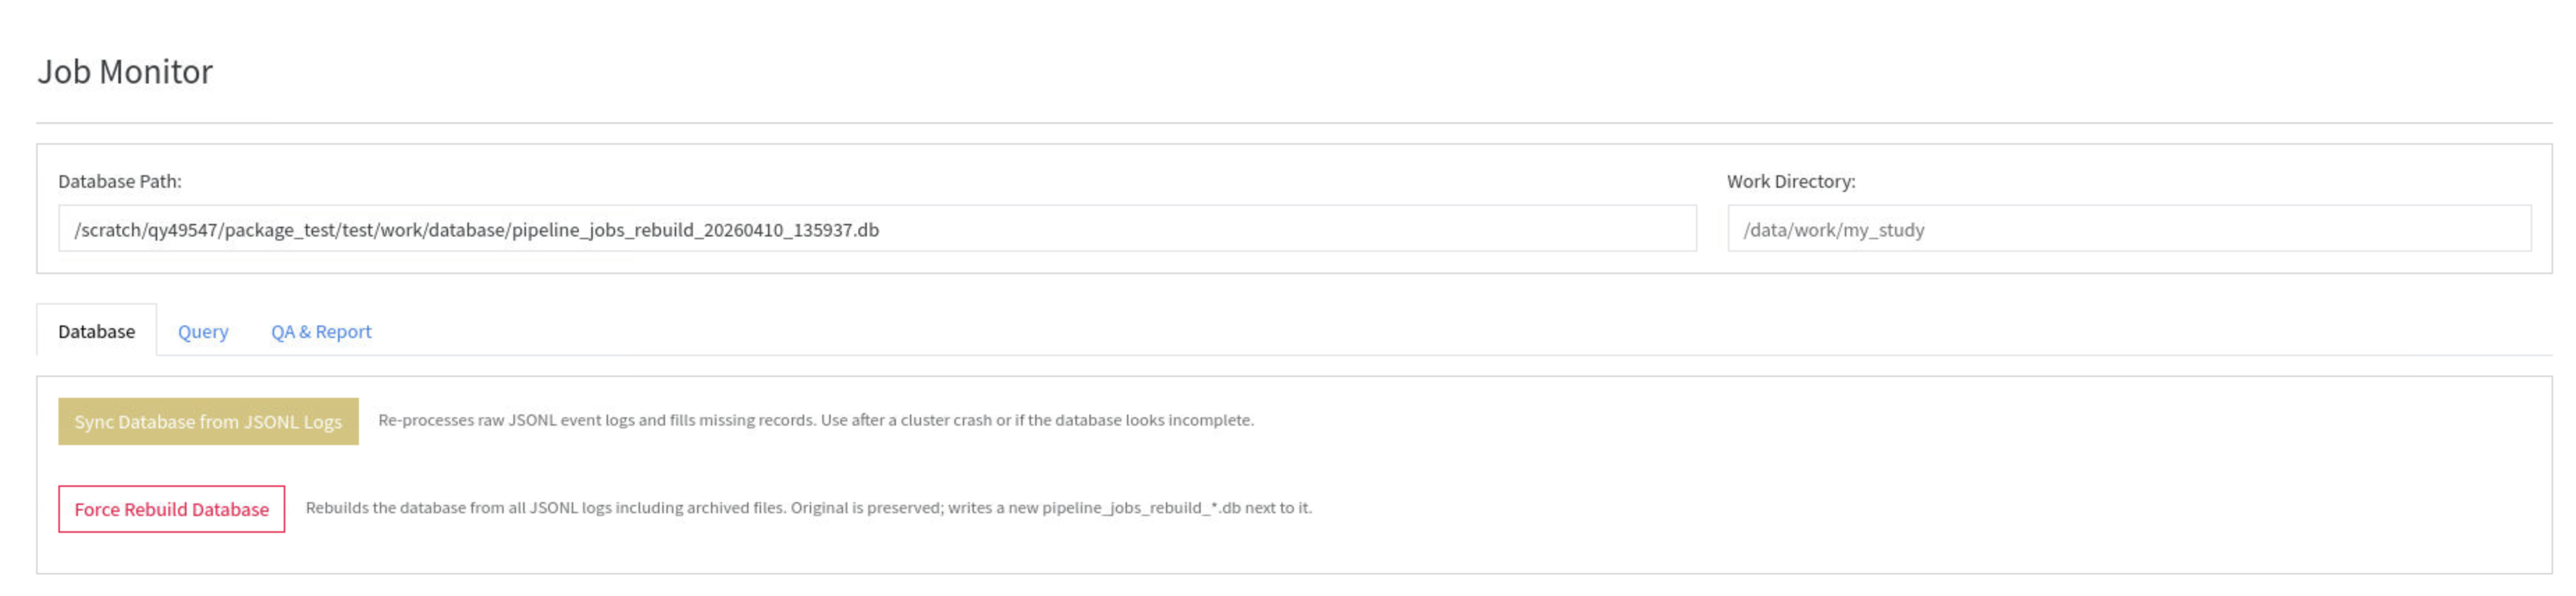
Two database maintenance actions:
Sync Database from JSONL Logs — runs
neuropipe merge-logsto populate the database from raw JSONL event files. Use this after jobs complete or if the database looks incomplete.Force Rebuild Database — runs
neuropipe force-rebuild, which scans all JSONL logs including archived ones and creates a freshpipeline_jobs_rebuild_{timestamp}.dbnext to the original. The original is never modified.
See Merge Logs Implementation for when to use each.
Query tab
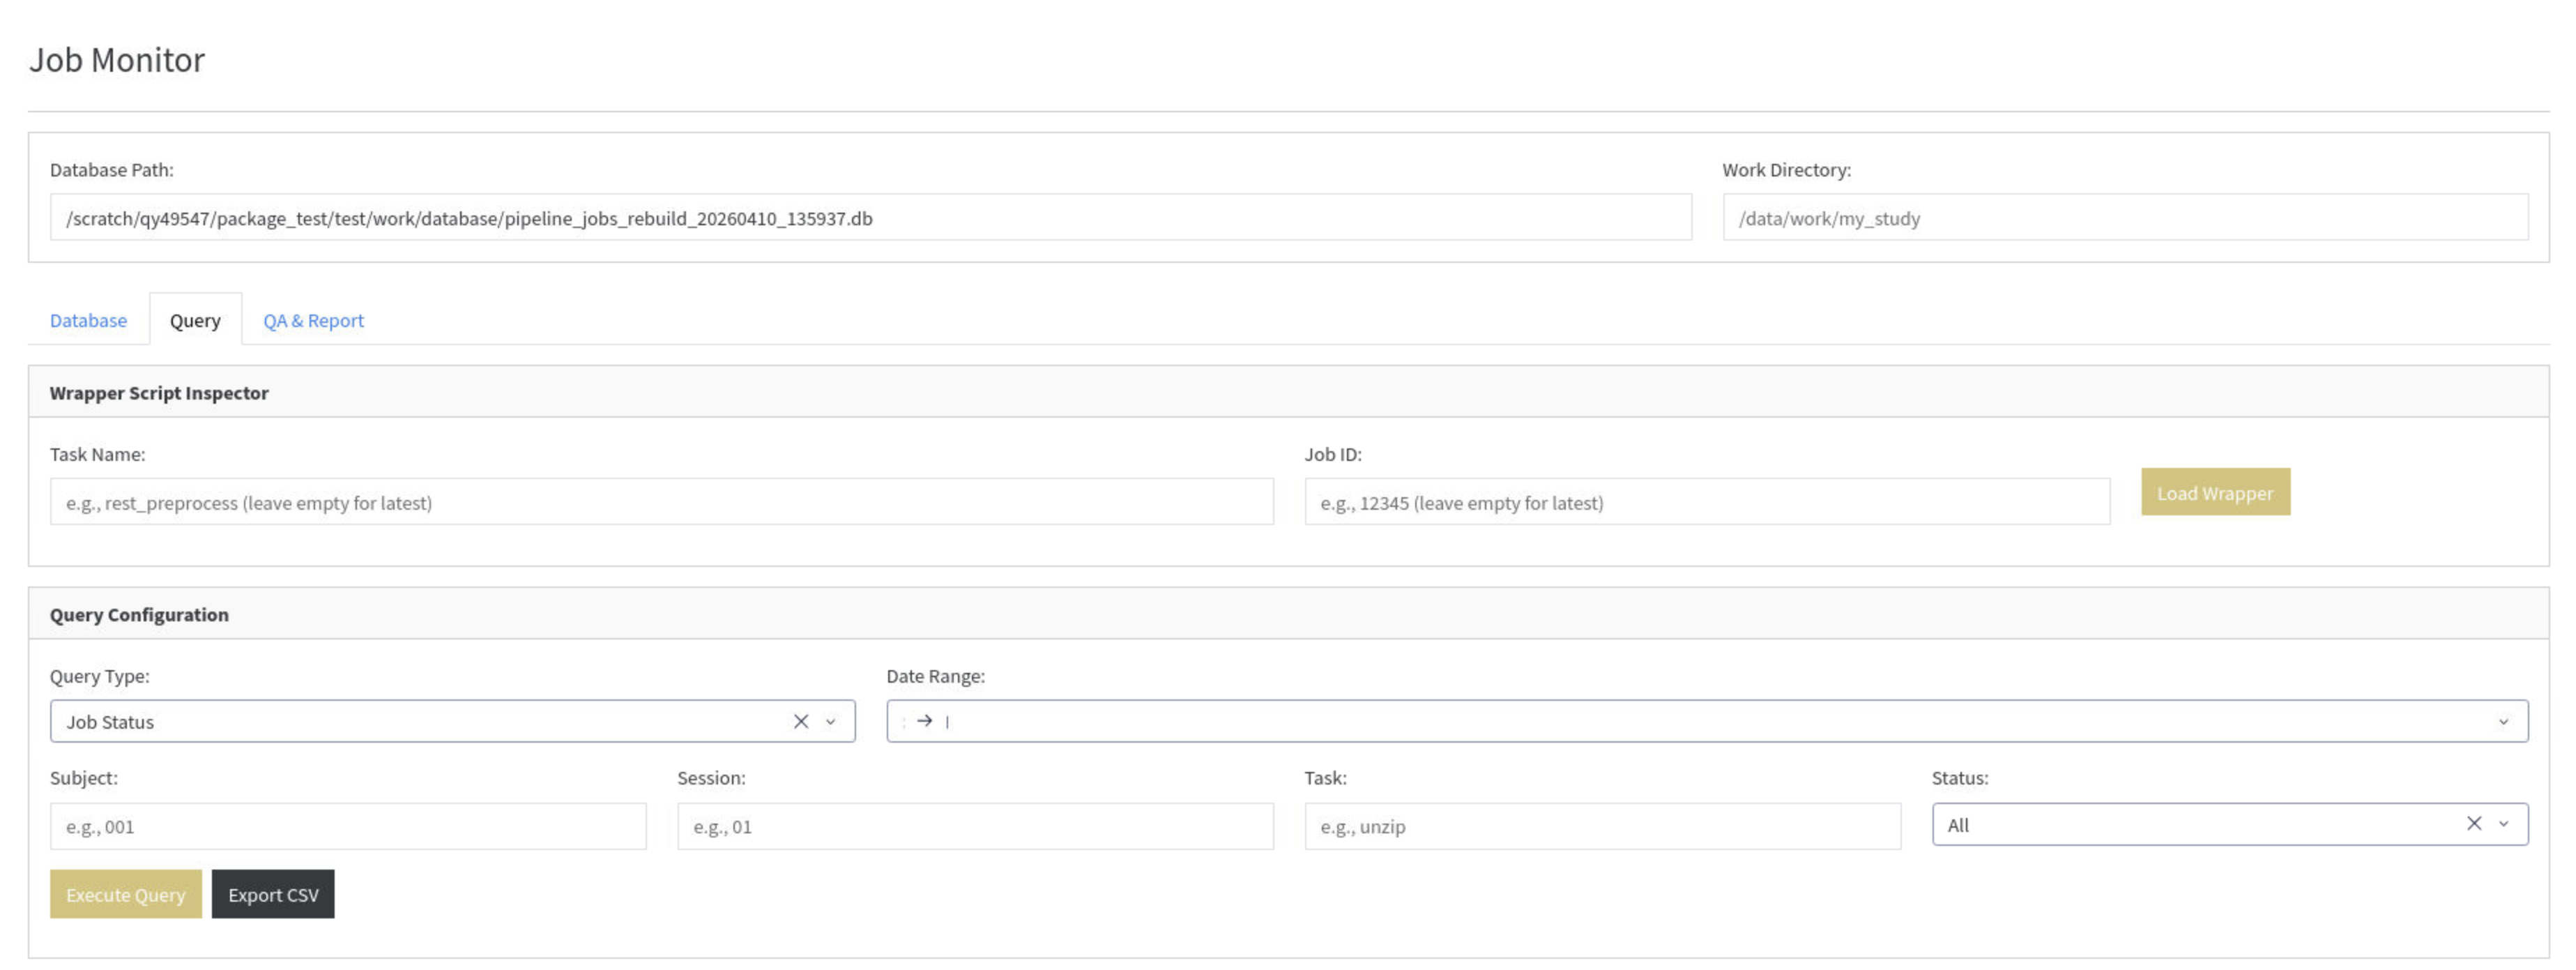
Wrapper Script Inspector — look up the exact wrapper script submitted for any job. Filter by task name and/or job ID (leave blank for the most recent). Shows all exported environment variables, module load commands, and the exact script call — useful for reproducing or debugging a specific submission.
Query Builder — query the job database directly without writing SQL. Select a query type and apply filters:
| Query type | Table queried | Use for |
|---|---|---|
| Job Status | job_status | Per-subject success/failure, durations, errors |
| Command Outputs | command_outputs | Captured stdout/stderr for each script run |
| Pipeline Executions | pipeline_executions | History of all neuropipe run invocations |
| Wrapper Scripts | wrapper_scripts | Submitted wrapper content per job |
Filter by subject, session, task name, status, and date range. Click Execute Query to run.
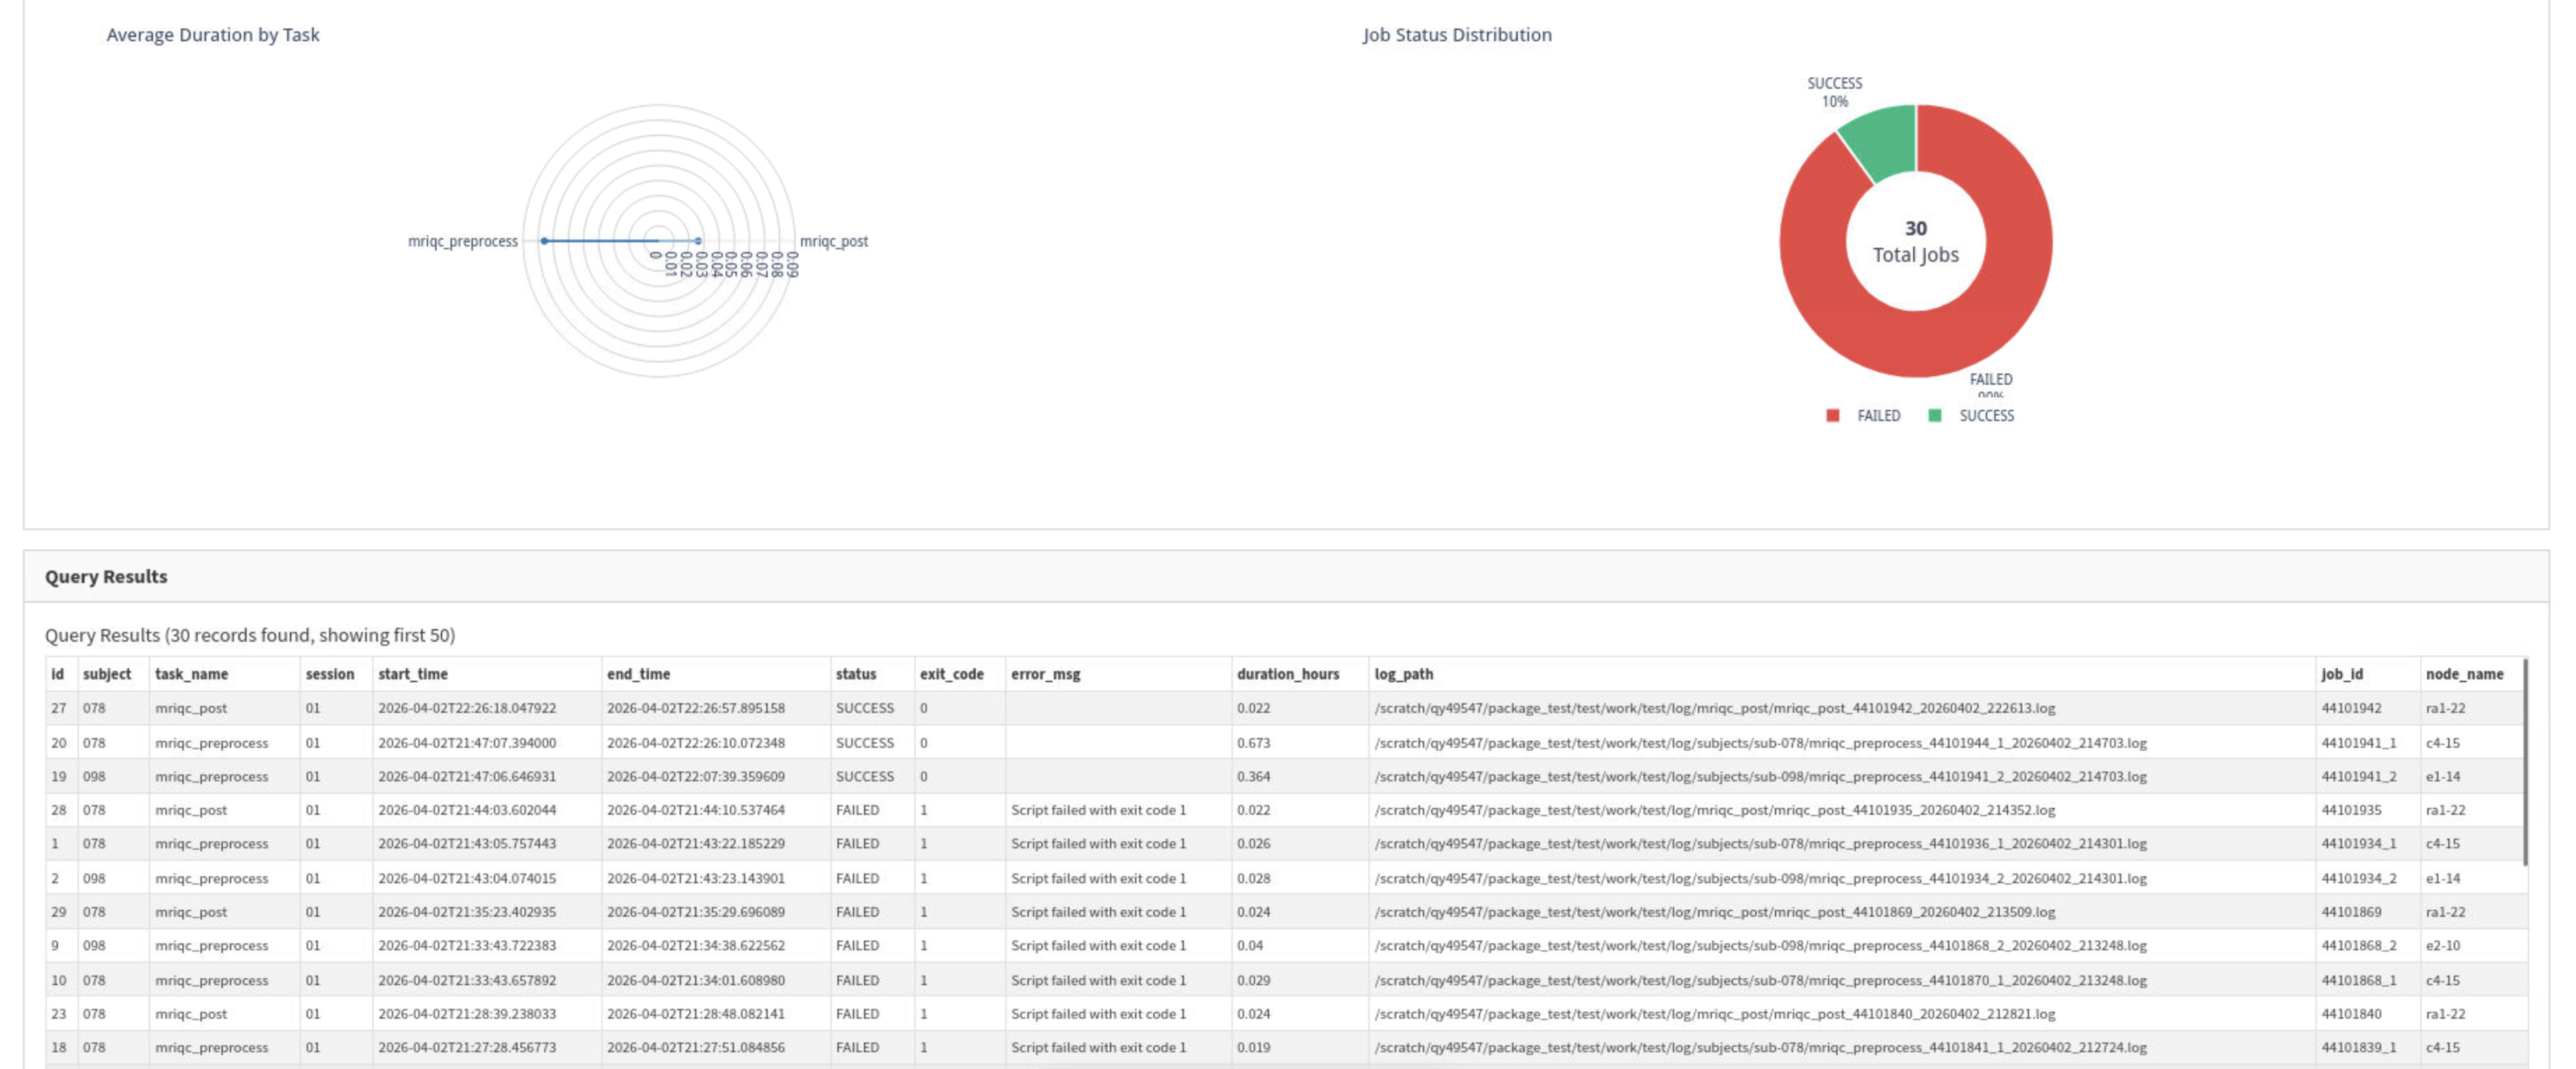
Results appear as a visualization panel (charts based on query type) and a paginated table. Export CSV saves the current query results to a file.
QA & Report tab
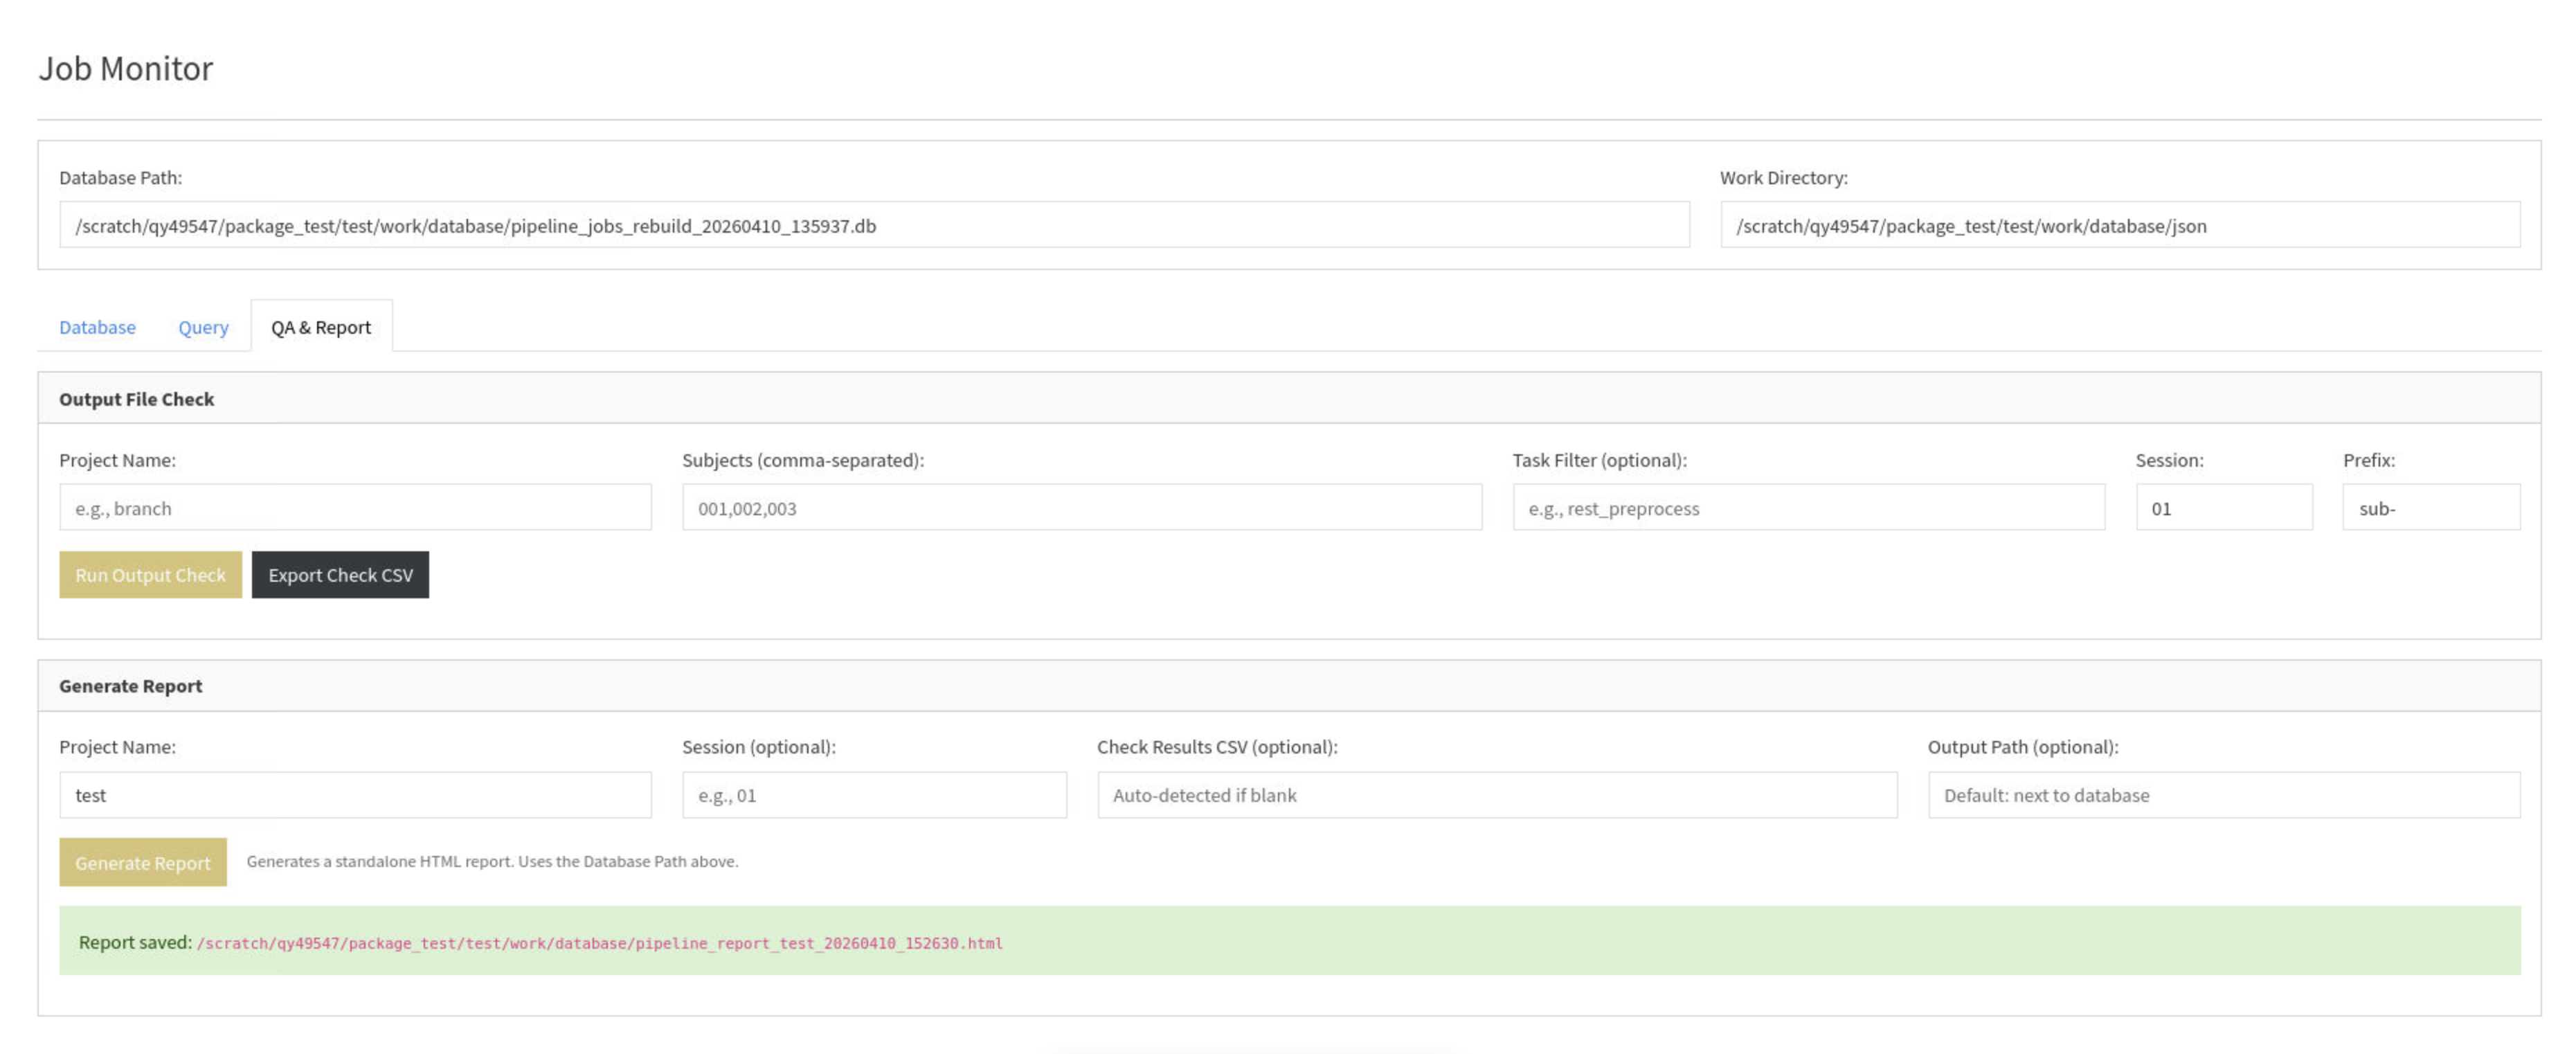
Output File Check — runs check-outputs from the GUI. Enter project name, subject list, optional task filter, session, and prefix, then click Run Output Check. Results appear inline. Export Check CSV saves the full per-subject results, equivalent to the CSV saved by neuropipe check-outputs.
Generate Report — generates a standalone HTML report from the job database. Enter the project name and optionally a session and check results CSV path (auto-detected if left blank). The output path defaults to next to the database file. See Post-Run Verification for a description of report sections.